Mechanics of Drafting in Cycling
By Cole Rutkowski, Cooper Wathem, and Danielle Swen

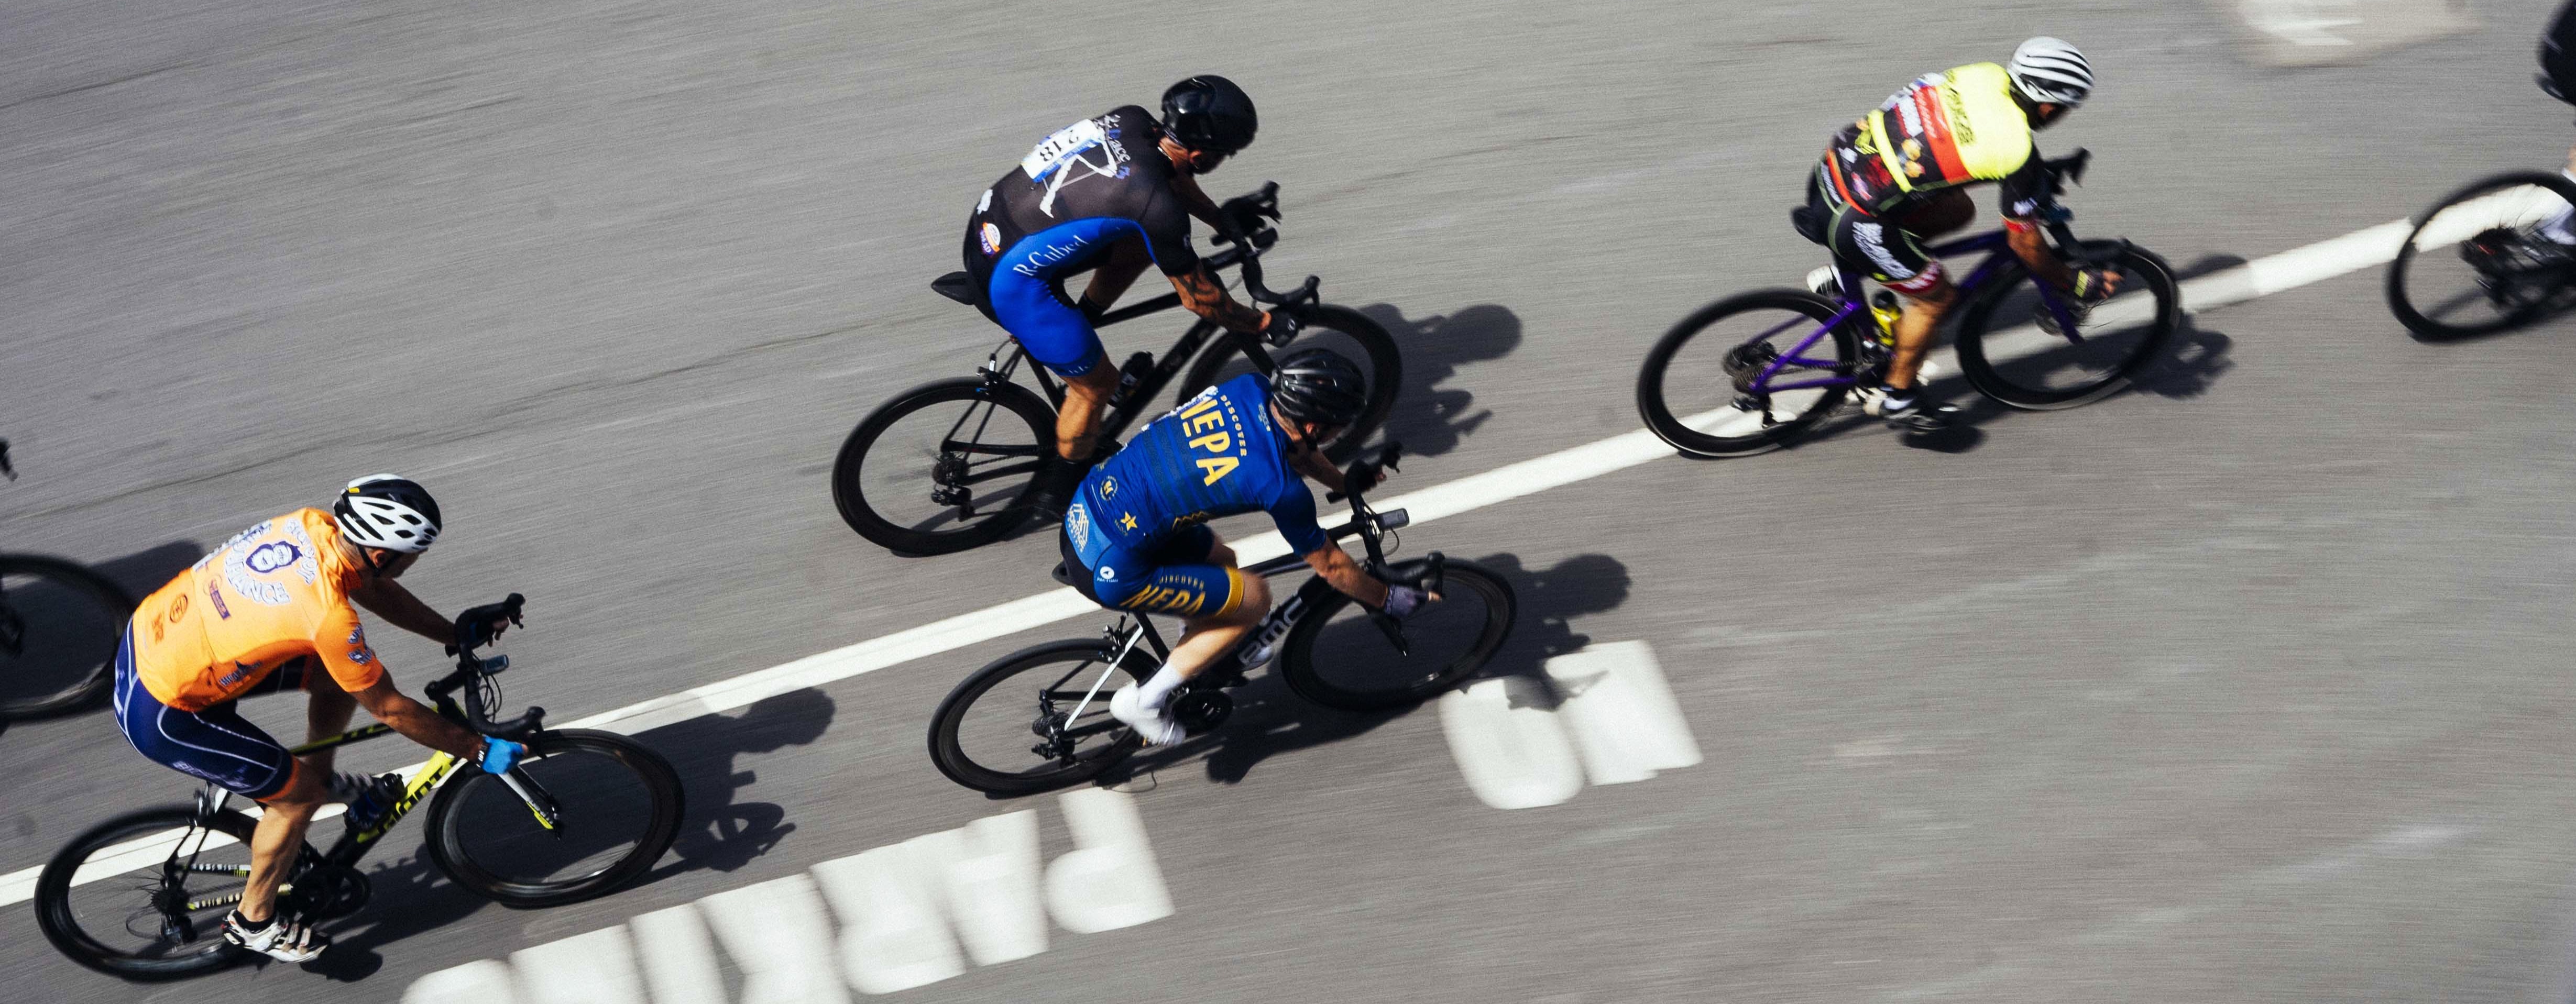
Paceline: a formation in which riders (especially bicycle racers) travel in a line, one close behind the other, in order to
conserve energy and travel faster by riding in the draft of the riders in front.
Introduction and Background
The first bicycles were invented in 1817 by the German baron, Karl von Drais [3]. 50 years later, the first documented bicycle race was held in Paris, France. Since then, bicycle designs have been continually updated to improve comfort, efficiency, speed, and weight. Along with bikes, race training and tactics have improved dramatically. In the first Tour de France, racers were local blue-collar workers and used 40 pound, single-speed, steel-framed bikes with wooden wheels. At the time, it was common practice to smoke a cigarette before big climbs to open up the lungs [1]. Now, racers are professional athletes that train 20-30 hours a week, ride high-tech carbon-composite bikes, and have access to a fleet of scientists and nutritionists. Since the first bicycle races, a specific race tactic has withstood the test of time and can be explained by fluid mechanic principles. This race-hack is crucial for success in modern day cycle races because of its significant impact on cycling speed and physical exertion. The concept is called “drafting”, which is when a cyclist rides behind one or more riders who break the wind for the back rider, significantly reducing the effort needed to maintain the front rider’s speed. Through a thorough understanding of fluid dynamic principles, we can discover how drafting works and its effect on the effort and speed of each rider in a paceline .We will look to answer a few questions to understand how drafting impacts cycling performance:
How does drafting affect the power output required by a front, middle, and back rider in a paceline at varying speeds? Will a longer line of cyclists be faster at a given power output than a single rider?
Constraints
This analysis of drafting in cycling operates under several simplifying assumptions and constraints to focus on the aerodynamic effects. The analysis is going to be completed with an assumed air density of 1.225 kg/m3 . Drafting changes the pressure difference between the air in front of and behind the cyclist, which changes the pressure drag. Because of this, we are assuming that drafting will not make any significant difference in friction drag and will therefore be excluding it from our analysis. Rolling resistance, skin friction, and other frictional forces, such as those within the bicycle's drivetrain, are ignored to isolate the influence of drag. The coefficient of drag is derived from empirical data borrowed from published studies, with the assumption that these values accurately represent the cyclists’ posture and equipment. Additionally, the analysis assumes 100% efficiency of the bicycles, meaning all the energy exerted by the riders is directly translated into forward motion, with no mechanical losses. Environmental factors such as crosswinds and terrain variations are also excluded, with the model considering steady-state cycling on flat terrain and in calm air. All cyclists and equipment are assumed to be homogeneous to ensure consistency in the aerodynamic analysis. Since the geometry of the cyclists and equipment are the same, the drag coefficient times the area (CDA) values will be constant from 6 m/s to 24 m/s. This is in line with our estimate for Reynold’s number at standard atmospheric conditions to be around 105 , and we will assume we remain in the turbulent region at these speeds. We will also take a detailed look at cyclists going 11m/s, or 40 km/h, which is the average speed of the Tour de France winner. These constraints allow for a more focused study but may limit the direct applicability of the findings to real-world conditions.
Fluid Dynamic Principles and Equations
The main fluid dynamic principles that we will consider are drag, Bernoulli’s principle, pressure
gradients, Reynold’s number, and drag coefficients.
Equation 1: Fdrag = ½ ρ v2 CDA (Newtons) (for high Reynold’s number)
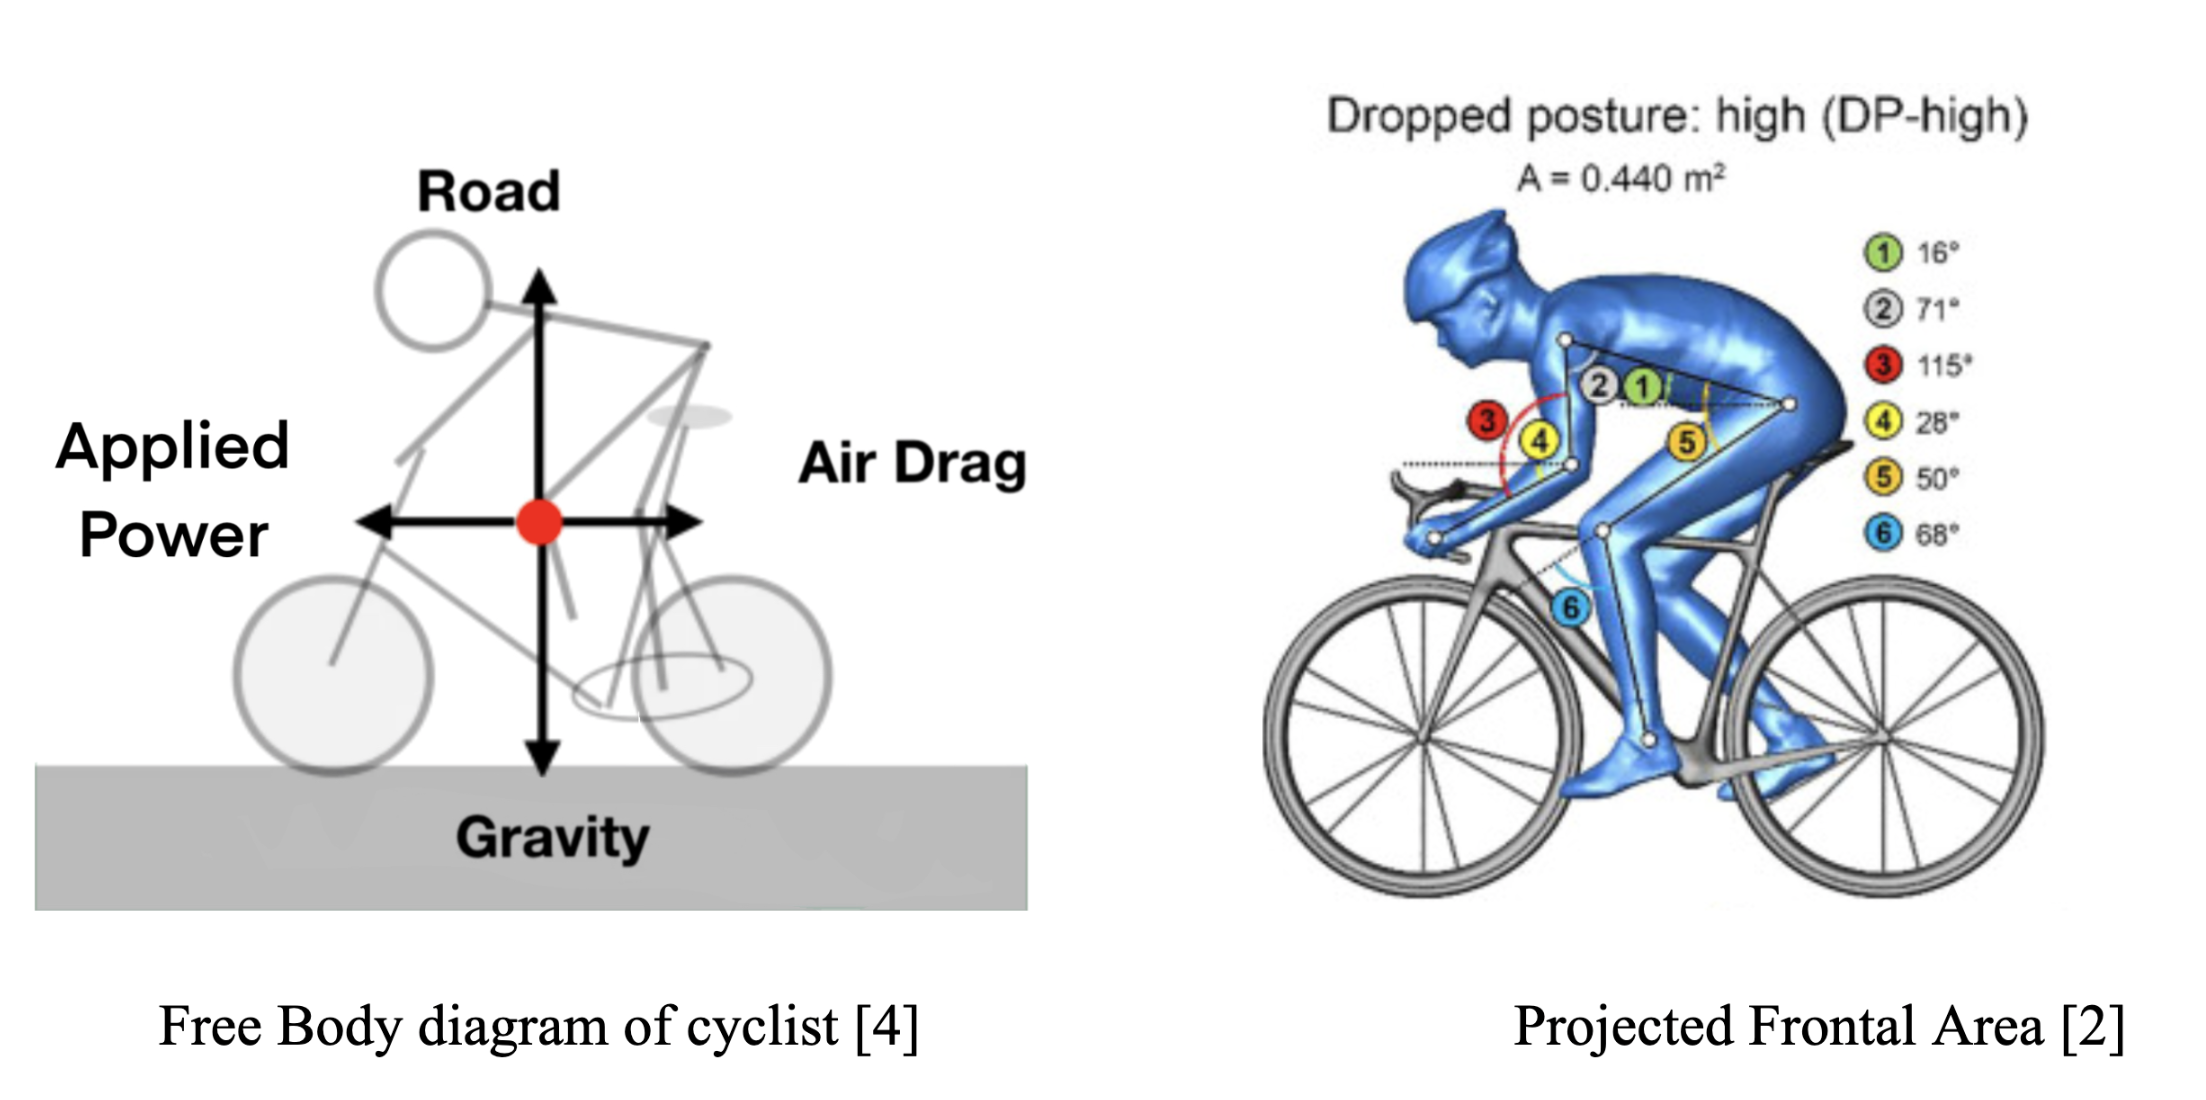
Where F is force of drag, ρ is density of fluid, v is fluid velocity relative to object, CD is
coefficient of drag, and A is cross-sectional area.
Equation 2: PD = FD v (Watts)
Where P is power required to overcome the drag force, FD is the drag force, and v is the
relative velocity of the fluid.
Equation 3: CD = ΔP / (.5 ρ U2) (unitless)
Where CD is the drag coefficient, ΔP is the pressure difference, ρ is the fluid density, and
U is the relative velocity of the fluid.
Drag, also known as pressure or form drag, is a force that acts in the opposite direction of an
object’s movement in a fluid. Drag is fundamentally caused by a difference in pressure between the
leading and trailing edges of an object. According to Bernoulli’s principle, the leading edge acts as a
stagnation point where air speed to the object is slowed, creating a high pressure area. At the trailing
edge, the airflow separates from the object, creating a turbulent, low-pressure wake zone. The drag force
is caused by this pressure difference, as the high-pressure region exerts a force as it tries to flow toward
the low pressure region.

In cycling, a drafting rider sits in the low-pressure zone of a leading rider, creating a smaller pressure difference for the drafting rider and thus decreasing the drag force. Consequently, the pressure difference for the leading rider is also reduced, meaning the lead rider experiences a lower drag force when someone drafts behind him!
Reynold’s number is a number to represent how turbulent the fluid flow is. Because we are analyzing cyclists going through air in an outdoor environment, with changing temperatures, pressures, and moving bodies, we are assuming that the flow is turbulent (Re = 105 ). This allows us to use the drag force equation for turbulent flow.
Drafting Analysis

Using the fundamental fluid mechanics equations above, we can calculate the relationship of power versus speed and compare the required power output to maintain a constant speed for the front, middle, and rear riders in pacelines of varying lengths. We will use a solo rider with no drafters as our control sample. We will then compare the speed of each cyclist at a constant power output. The analysis will be using the values from the CDA table below [2] to calculate the power required to overcome the drag force on the cyclists.

This method allows us to quantify and visualize the efficiency gains from drafting and evaluate how the required power varies across different positions in a paceline compared to solo riding.

How does drafting affect the power output required by a front, middle, and back rider in a paceline at varying speeds?
In [Graph 1], we compare the power vs speed of the front, middle, and back cyclists in varying length pacelines. We can see there is a significant reduction in power at a given speed for a cyclist drafting behind more riders. Graph 1 shows that the seventh cyclist in the back of a seven person paceline has the least amount of power required to overcome the drag force out of all of the other positions displayed. We will focus on a five person paceline to take a detailed look at the effect of position on drag force and power output.
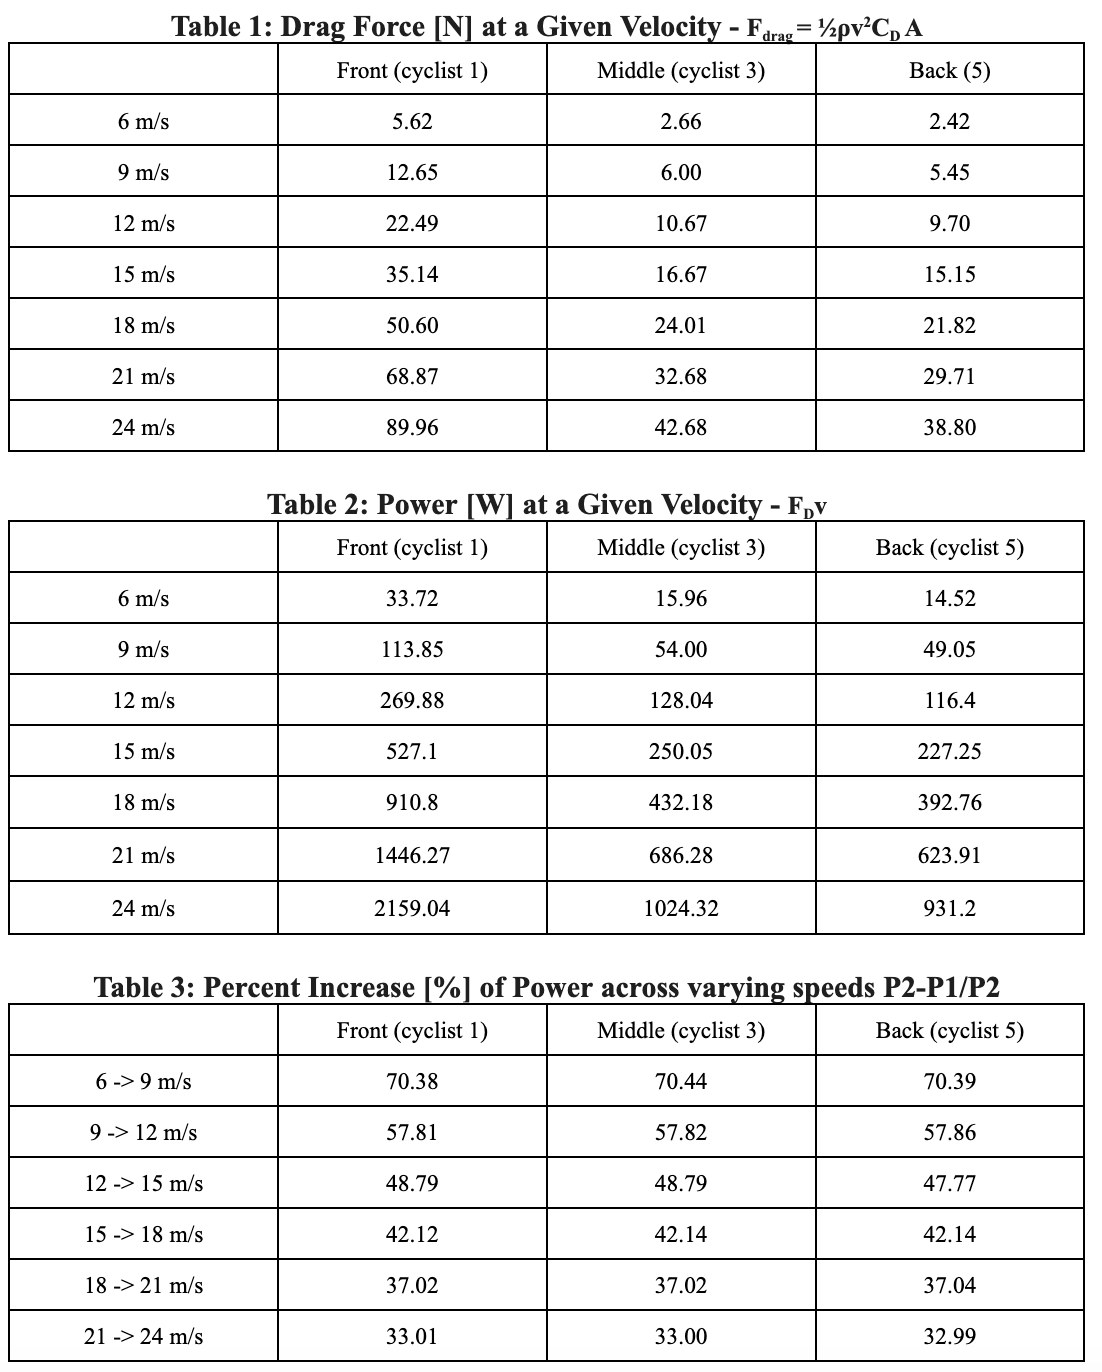
Using [[Table 1], [Table 2], and [Table 3], we can gain an understanding as to how drafting affects power output across a paceline at varying speeds. Table 1 represents the drag force of a cyclist in its respective position with a given CDA value and velocity using equation [1]. Table 2 is the power output required to overcome that drag force using equation [2]. Table 3 displays the percent increase of power of the cyclist between two given velocities. Across the rows, the percent increase in power required shows to be the same amount between two speeds for front, middle, and back cyclists. This makes sense because the change in velocity is the same for all three positions. When the percent increase is compared in the direction of increasing speed for a single cyclist, the percent increase in power required to overcome drag force begins to fall as velocity increases. Therefore, as speed increases, the power required by the cyclists decreases and the drafting effect becomes more beneficial. The cyclist will still have to put in power to increase their speed, however, the drafting effect will reduce the drag force the cyclist has to overcome, making it easier for them to go faster.
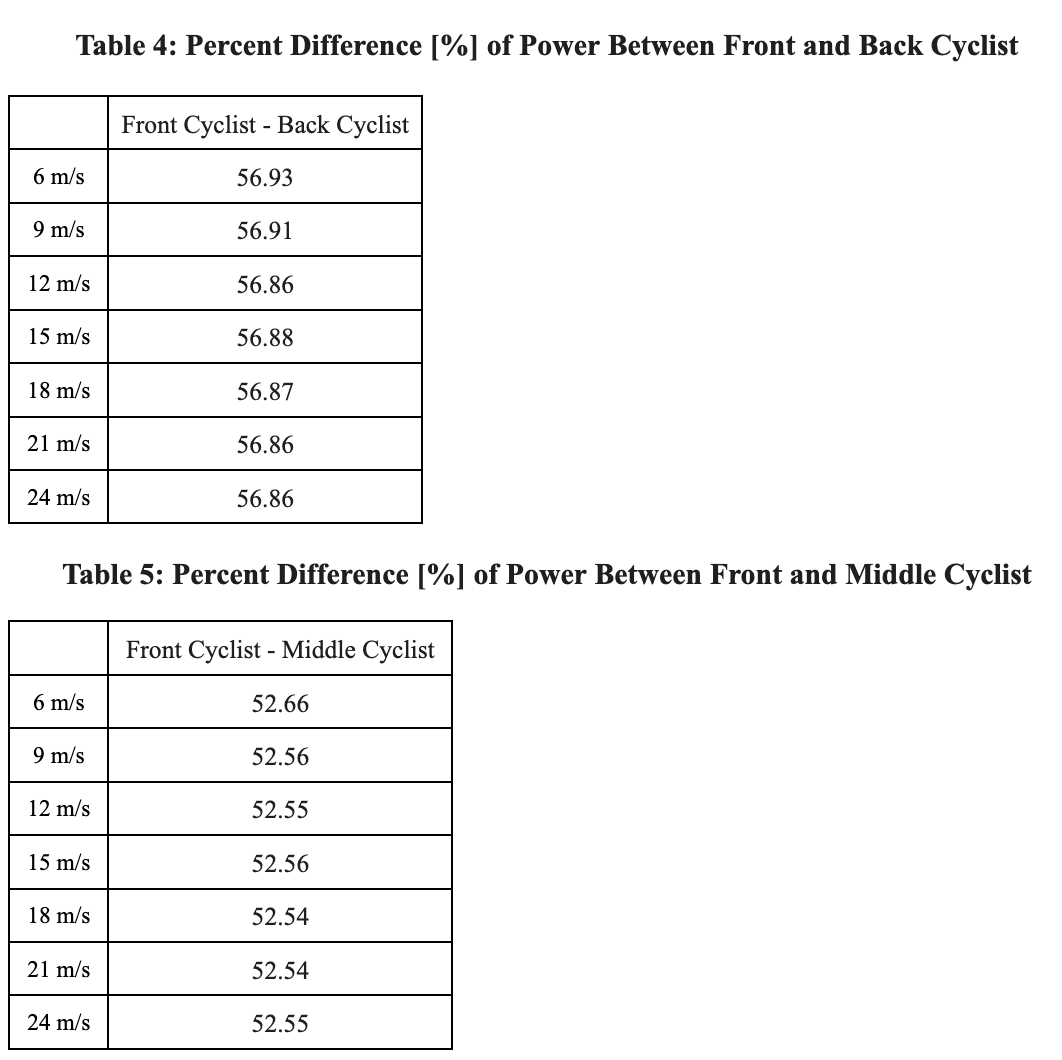
Comparing the percent difference of power required between the first and middle cyclist in [Table 5], and the first and back cyclist in [Table 4] shows that the percent differences of power to overcome the drag force remains constant over varying speeds, with the average difference between the first and middle position being 52.56% and average difference between the first and back position being 56.88%. These results demonstrate that drafting results in a significant drop in power required to maintain a constant speed.
Will a longer line of cyclists be faster at a given power output than a single rider?
To answer this question, we explored the relationship between speed and aerodynamic drag while holding power constant. Using equations [1] and [2], we calculated the speed v at a specific power output. We assumed a constant power output of 200 watts for the front, middle, and back riders, which aligns with the approximate power output of the front rider as shown in [Table 6]. The mean drag area CDA for each cyclist was taken from Table A1 [2] and held constant for each respective position in the paceline.
The results depicted in [Graph 3] illustrate that a rider further back in a paceline benefits significantly from reduced aerodynamic drag, allowing them to maintain much higher speeds at the same power output. This is a direct result of drafting, which reduces the pressure difference and lowers drag force on a rider due to the wake created by those ahead. Notably, the speed advantage becomes more pronounced as the paceline grows in length. Graph 3 clearly depicts the increase in speed of the middle and last rider for each subsequent paceline length, which holds true for a paceline from 1 to 8 riders. It is most notable that there is an advantage for the lead rider in the paceline, who can go faster at a given power output when he has riders in his wake. Thus, we can conclude that a longer paceline of up to 8 riders is indeed faster at a given power output than a shorter paceline.
Conclusion
Using fluid mechanical principles and empirical data, this analysis showcases why drafting is a critical tactic for competitive cycling success. Drafting significantly lowers aerodynamic drag because when a drafting rider sits in the low pressure region of a leading rider, the pressure difference that drives drag force is reduced. This reduction in drag decreases the power required for trailing riders by up to 57% for a five person paceline compared to the leading rider, enabling greater energy efficiency. Additionally, longer pacelines amplify these results, allowing all riders to achieve higher speeds at the same power output. These findings reaffirm the critical role of drafting in optimizing performance and efficiency in cycling
In expanding this research to a graduate or industrial level context, we would incorporate real world variables such as crosswinds, varying terrains, or changing rider formations to create a more accurate assessment of the drag that riders will experience. We are especially interested in the efficiency of a rotating paceline compared to a static paceline, as well as the efficiency across different paceline structures. Additionally, exploring Computational Fluid Dynamic (CFD) models could expand understanding of aerodynamic interactions in different paceline configurations. This expanded understanding would provide deeper insights for optimizing cycling performance.
Supplemental Data


Citations
[1] C. Henrys, “ The bikes of the Tour de France: a brief history of the race-winning
machines,” RoadCyclingUK, Jul. 11, 2016.
https://roadcyclinguk.com/gear/bikes-tour-de-france-brief-history-race-winning-machines.html
[2] T. Van Druenen and B. Blocken, “Aerodynamic impact of cycling postures on drafting in
single paceline configurations,” ScienceDirect, May 15, 2023.
https://www.sciencedirect.com/science/article/pii/S0045793023000889#cebibl1
[3] E. Andrews, “The Bicycle’s Bumpy History,” HISTORY, Jun. 30, 2017.
https://www.history.com/news/bicycle-history-invention
[4] Allain, Rhett. “The Physics of Drafting in the Tour de France.” Wired, Conde Nast, 23 July
2018.
www.wired.com/story/the-physics-of-drafting-in-the-tour-de-france/